How topology and geometry could help research funding bodies make decisions
July 11, 2021
By Lucy Goodchild van Hilten

A University of Oxford PhD candidate talks about his research collaboration with Elsevier
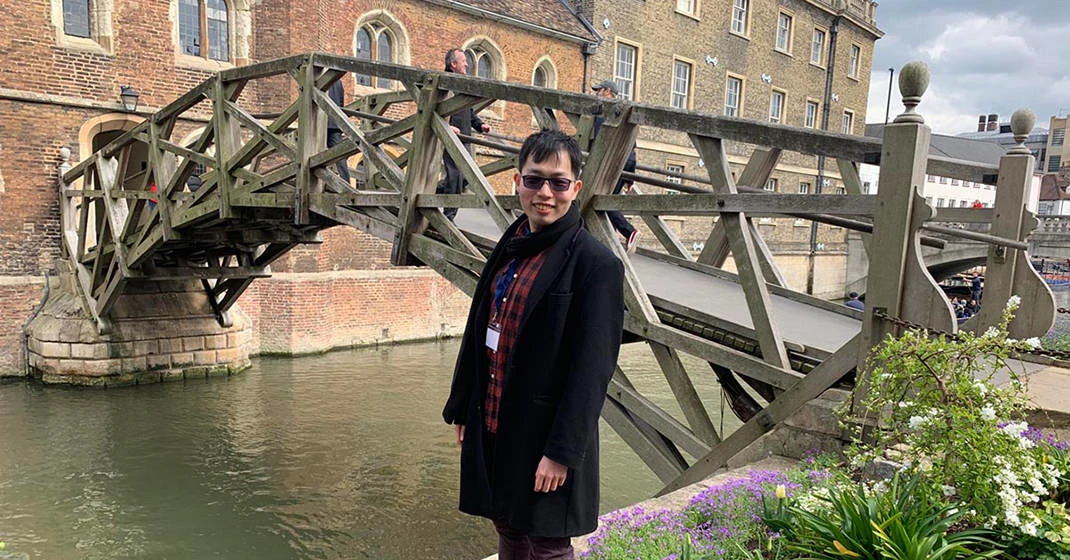
Pictured above: Ambrose Yim is working with Elsevier’s as a research student at the University of Oxford’s Industrially Focused Mathematical Modelling Center for Doctoral Training.
When Ambrose “Ka Man” Yim started his undergraduate studies at the University of Oxford, he wasn’t sure whether he wanted to go into academia or industry. But he soon realized he was motivated by real-world questions, so he needed a way to try out both worlds:
I want my research to have an impact. I wouldn’t feel comfortable sitting in front of a whiteboard for 20 years and pursuing things only because it is mathematically beautiful, especially when math can be both beautiful and relevant. Some people are fine with that — it’s just not me.
Now, as a postgraduate research student in the Industrially Focused Mathematical Modelling (InFoMM) Centre for Doctoral Training, he is working with Elsevier using Scopus and SciVal data to answer research evaluation questions.
His work applies ideas from the mathematics of geometry and topology to better understand things like the best way to allocate funding equally across topics, and how trends evolve and converge in the topics that journals publish. The results of his PhD work could provide a valuable basis for decision making in an increasingly resource-constrained and competitive funding environment.
A serendipitous collaboration
Ambrose’s work with Elsevier began through a connection made by his supervisor, who introduced him to Dr Andrew Plume, President of Elsevier’s International Center for the Study of Research (ICSR) and Senior Director of Research Evaluation at Elsevier. Andrew introduced some interesting research questions and data sets. Ambrose was excited:
At the beginning, we discovered potential questions we can answer using the data, and we then went shopping for the mathematical tools. It's one of the wonderful things about working in applied math. You don't know what your next challenge might be and what mathematics you need to tackle it. I’ve been given this a huge playground to explore, and I could go back to the math world and pick something off the shelf and see whether it could be useful for one of our problems.
The kind of math tools and techniques on Ambrose’s shelf are from the field of topological data analysis, which aim to quantify the shape of data. He explained:
Extracting insights from data is like a Q&A session. You need to pose precise and clearly defined questions to get meaningful answers. By phrasing the questions in the language of geometry and topology, we gain rigorous insights that are conceptually familiar and interpretable.
Computing journal topic trends
With several interesting questions and a range of techniques Ambrose was familiar with, he began to make connections. Ambrose and Andrew focused on two projects in the collaboration, which has been running for more than a year. In the first, they wanted to gain insights into research trends from a body of academic articles:
You can imagine research trends don't move in parallel; they interact. We really wanted to find a mathematical technique that indicates where two research trends are intersecting or show a trend splitting into several smaller trends. The aim was to compute that based on the notion of similarity between papers and how papers are added to a journal over time.
Similarity and size of data — and what they mean for funding
Early on in the collaboration, Ambrose attended a seminar on a topic adjacent to his field, which was about measuring the “size” of data that is similar.
The concept of “effective size” can be explained like this: if there are two completely distinct things in a data set, those two things should be counted as individual entities, and the collection is considered to be size two. But if the two things are duplicates, they should only be counted as one, so the collection would be size one. There is a gray area between one and two where items may not be entirely distinct but not exactly the same, and this notion of similarity would be shown in a value of effective size between one and two.
Similarly, this concept can be used to think about sampling datasets efficiently. To sample the collection with maximal diversity, you want to select objects that are as dissimilar from each other as possible to explore the full space of the collection. The larger the effective size of a dataset, the more samples you would need to capture the full diversity of the dataset.
Ambrose was interested in this concept, and on a visit to Elsevier in Oxford, he asked Andrew if it would be useful somewhere. Together, they came up with an interesting approach to analyzing research funding distribution. Ambrose explained the theory behind it:
Imagine if you are a funder and you have a collection of topics you want to fund in the most equitable way. They are all of similar priority to you, but some of these topics are similar to others. For example, you might be interested in funding research on conserving giant pandas, red pandas and dolphins. Since the two pandas are more similar to each other than they are to dolphins, dolphin conservation is unlikely to receive a ‘knock on’ effect from reseach the conservation of either pandas, and vice versa. Rather than splitting funds evenly between the three species, you might divert a little more to dolphins and less to each of the pandas. Our approach takes similarities into account and spreads out your funding in the most equitable way.
Ambrose and Andrew used an Elsevier journal as a test case for this technique: the International Journal of Impact Engineering. They found that in the articles published in the journal, there was a drop in the effective size in relation to how frequently keywords are shared between articles. This suggests authors used increasingly similar keywords over time — what Ambrose calls a “collimation of ideas.”
This technique comes from pure math, and by taking it off the shelf, Ambrose is able to apply it to real-life data — in this case, to funding allocation. The result could be an algorithm that provides the most equitable approach to allocating resources, given similarities in topics. This would give funding bodies an agnostic way of funding topics of equal priority:
In real life, people have priorities, and funding bodies don’t fund things in a totally spread-out way. In a sense, computing this most spread-out distribution is a control that reviews latent priorities that are reflected in the funding decisions a funding body makes. Of course, in real life there’s give and take, and some further nuances, but this might be the baseline funding bodies could use.
Partnering with Elsevier
Ambrose aims to develop the funding research in the near future, using new data sets, to provide a tool that helps funding bodies allocate resources. Meanwhile, research like the topic trend insights comes together to build on the central aim: to use new techniques to derive probes they can put in data and reveal signatures people can act on to gain new insights.
The application of the research was an important factor for Ambrose when he started the collaboration with Elsevier. He knew he would be working with an industry partner when he started the PhD with InFoMM, and in the first year of the program, he was trained in a variety of techniques that could be applied to industrial problems. After completing mini projects with British Telecom and Emirates, the time came to choose a partner for his funded research project, and Ambrose chose Elsevier. Flexibility in the project has already enabled Ambrose to develop his applied research:
I’m really grateful that when Andrew and I first met, we took a fairly liberal view and kept an open mind about the research questions we wanted to answer and the tools we wanted to use. It was definitely a case of letting the questions and the math take us to the next step. That’s really exciting, and it has been a very fruitful journey for me. I hope it's been useful to people like Andrew as well.
Using math to develop policy
Ambrose is already thinking more broadly about the application of the techniques he has used in the research with Elsevier. For example, looking at the funding question from the other side — the researcher’s point of view — raises a new question. Ambrose believes funding bodies could help researchers as they plan their projects and apply for grants.
I think the novelty of this is people don't really take the similarities between topics into consideration. We want to see whether taking inherent similarity between topics makes a difference. This is a dance between funders and the people seeking funding. If there is a very clear signal, with funding bodies saying, ‘Here are the priorities,’ I'm sure people would respond to that.
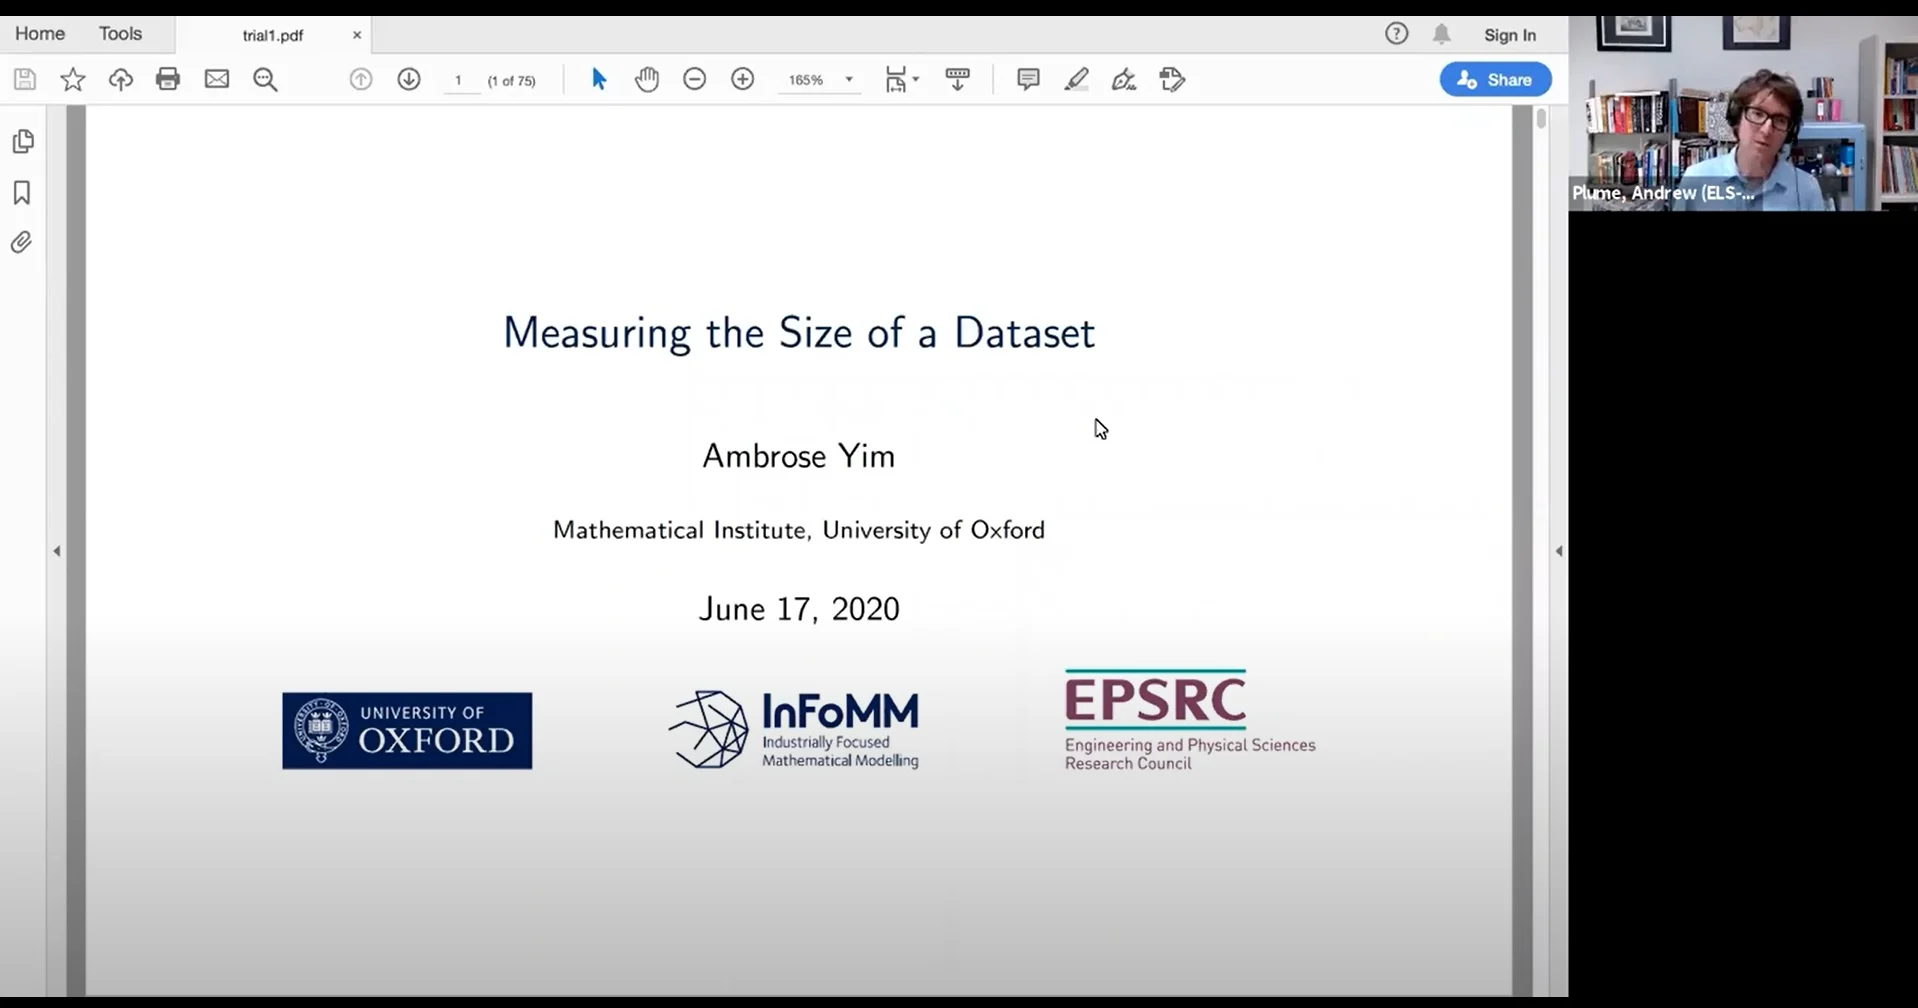
In addition to the ongoing research, Ambrose wanted to produce small test cases or prototypes based on general techniques that people at Elsevier could apply in their work. One example is an idea that came up in the Q&A session following Ambrose’s recent webinar about applying the effective size techniques to Elsevier’s recommender systems in SciVal.
Measuring the Size of a Data Set

Watch now
|
Measuring the Size of a Data Set
Ambrose is aiming to wrap up the PhD research soon, and beyond that, COVID-19 is causing a lot of uncertainty. But economic context aside, his dream job would involve applying data science to public policy, perhaps at an NGO.
It’s a niche area, but I think people are starting to be more inclined towards these ideas. For example, the UK government are beginning to say, ‘We want some data science in policymaking.’
At some point in the future we'll look back at this pandemic period and see that politicians who might not be so scientifically aware suddenly had to grapple with scientific concepts in their decision making. I think this has bolstered the case for how important science is in general, and for decision making.
That's one glimmer of hope.
Contributor

Lucy Goodchild van Hilten
Science Writer
TellLucy