The art of detecting data and image manipulation
November 4, 2013
By Anthony Newman
“… a false statement of fact, made deliberately, is the most serious crime a scientist can commit.” English Chemist and novelist, Charles Percy Snow (1905-1980)
Over the years, numerous initiatives have been launched to educate authors about the dangers of manipulating data and images in their journal submissions — in fact, we discuss two of our own programs in The importance of author education in this Ethics Special.
While many of these have met with success, there is no doubt this kind of behavior remains more common than we would wish. In this article, we focus on some of the tools and processes developed to detect data and image manipulation. Dr Jacques Piette, Editor of Biochemical Pharmacologyopens in new tab/window, shares his eight-point plan to control submitted Western Blotsopens in new tab/window, while Dr John Dahlberg, of The Office of Research Integrity (ORI), talks about how his organization can help identify manipulation and offers insight into the techniques used by its investigators. Dr Dahlberg has also kindly offered to share with readers a program the ORI uses to identify potentially fabricated numbers — further details of which you will find below.

But most of all, we hope this article proves the starting point of a wider discussion on this topic — we want to hear your views. Please let us know your thoughts on how data and image manipulation can be better managed in your field by posting your comments below.
The International Federation of Clinical Chemistry and Laboratory Medicineopens in new tab/window (IFCC) offers the following guidance on graphics editing:
“For clarity, figures may be adjusted to better see the item being discussed as long as such changes do not obscure or eliminate information present in the original image. However any changes (brightness, contrast, color balance, etc.) must be made overall, and mentioned in the figure caption. An original image file must be retained in case it is required by the peer-review process. Do not remove or move anything in an image, or clean up an image.”
Tools to detect fraud at The Office of Research Integrity (ORI)
The Office of Research Integrity (ORI) is responsible for oversight reviews of investigations into allegations of research misconduct that involve research funded — at least in part — by agencies of the US Public Health Service.
According to John Dahlberg, PhD, Deputy Director of the ORI, an oversight review is essentially a “de novo review of the institutional record” and is carried out by the ORI’s Division of Investigative Oversight (DIO); ten scientists and physician-researchers with a wide range of disciplinary backgrounds.
He said: “The pace at which they are being asked to examine research is increasing dramatically. Over the years, DIO employees have developed a number of computer-aided approaches to examining data and other research records to strengthen the evidence for research misconduct in cases where findings appear warranted.”

Dr John Dahlberg
Here, Dr Dahlberg guides us through some of those tools and processes, many of which are available to the public, and shares some useful tips from the team.
ORI’s forensic image tools
Forensic droplets: Firstposted on the ORI website in 2005, droplets are small desktop applications in Adobe Photoshop that automatically process files dragged onto the icon. They are available to downloadopens in new tab/window from ORI’s website and allow you to quickly examine the details of a scientific image in Photoshop while reading the publication in the full text (html) form or in the PDF form in an Internet Browser.
The droplets have a variety of uses and can help you to:
Find out whether an image’s light or dark areas have been adjusted
Evaluate whether two images may have been obtained from a single source
Compare two images
Photoshop Actions: ORI also posted a number of Photoshop actionsopens in new tab/window in 2005 and an advanced setopens in new tab/window of these has been developed for later Photoshop versions. The actions differ from the droplets in that they pause to allow the user to make a choice in how to proceed with the analysis of the image(s).
Other image tools used by the Division of Investigative Oversight (DIO):
Adobe Bridge: This softwareopens in new tab/window can generate libraries of images for rapid screening — images can be organized by date or file size, and the large thumbnail size allows careful viewing of each image. This is particularly useful when searching for sequential versions of files that have been modified, where they are likely to be very similar in size and their time-date stamps are closely spaced.
ImageJ: This programopens in new tab/window is available for a variety of platforms and can be freely downloaded from the National Institutes of Healthopens in new tab/window (NIH) website. It is very versatile and the DIO finds it particularly useful for producing quantitative scans of gel bands, for example.
DIO has also discovered research misconduct in PowerPoint images by using the ‘Reset Picture’ tool. On numerous occasions, this has revealed the use of underlying images and, in several cases, those underlying images turned out to have been scanned from unrelated published papers. It is also possible to reset images in some PDF files viewed in Adobe Acrobat.
Examining questionable data
Review of questioned numbers: Research (1-4) has shown that when people are asked to write random numbers, they do a poor job. James Mosimann, a bio-statistician at ORI in the 1990s, recognized that if sets of numbers in respondents’ notebooks purportedly obtained by transcribing them from instruments such as scintillation counters or spectrophotometers were unaccompanied by the original data printouts, then they might have been fabricated. He also reasoned that while the digits on the left side of a number would be expected to be non-uniform (because they conveyed the results of the experiment) those in the right-most positions ought to be uniformly distributed. He developed a program to calculate chi-square values and corresponding probabilities based on the distribution of right-most digits in sets of numbers sufficiently large enough (>50 digits). Columns of numbers saved as a text file can be imported into his program. The DIO requires control data from similar unquestioned experiments carried out in the same laboratory. In quite a number of cases, while right-most digits from control numbers have been shown to be uniformly distributed, this has not been true of the questioned numbers.
Although not publicly available, the ORI has kindly agreed to provide a copy of James Mosimann's program to interested editors along with instructions. It is usable in Windows through version 7, but does not load in Windows 8. If you would like to receive a copy, please contact Dr Dahlberg at [email protected]opens in new tab/window.
Issues with spreadsheet files: ORI has made findings in several cases involving the discovery of embedded formulae in spreadsheets that calculate backwards; in other words, a formula is used to calculate the raw data value from the final claimed result. The formula in an Excel cell is visible in the formula bar when a cell in highlighted, while all of the formulae in the spreadsheet can be displayed in Excel (Microsoft Office 2007 version) by pressing the “control + ~” keys (control/plus/grave accent) simultaneously. Pressing the same three keys restores the normal view. Even when formulae have been removed from a spreadsheet, the format of the numbers in the columns may be informative. Calculated values usually have long digit strings to the right of a decimal, and data input values often do not — this can be revealed by setting the cell number format to ‘general’.
Converting graphs back to spreadsheet values: ORI has frequently found it necessary to compare published graph data with raw notebook or computer data to determine if it has been reported accurately. Similarly, they can see if the published standard errors or standard deviations — expressed as error bars — are adequately reflective of the raw data. It is also often desirable to compare graphs published in different grant applications or papers that are labeled as coming from different experiments but which appear to have identical values. To accomplish this, DIO has used computer software (5) to convert images to spreadsheet values.
In several cases, ORI has determined that error bars seem improbably small, or of a fixed percentage of the experimental values. Fixed error bars at, say, 5 percent of the height of the histogram bars in the graphs, are not reflective of typical biological experiments, and warrant a review by the institution to determine if the experiment(s) were actually conducted as described.
Forensic review of sequestered digital data: In recent years, DIO has increasingly relied on the forensic examination of sequestered digital data, particularly of hard drives. This is reflective of increasing reliance by the scientific community on storage of data on computers rather than in notebooks. Whenever possible, ORI advises institutions to acquire forensic copies of digital data, which may involve the expertise of IT personnel and special hardware and software. There are multiple advantages to acquiring image copies in comparison to simply copying files onto CDs or other media; for example, time-date stamps are accurately preserved and forensic software can recover erased files as long as they have not been overwritten by a more recently saved file.
Eight tips to prevent Western Blot manipulation
Western Blots — a highly valuable technique to separate proteins by structure or size — is a widely-used method. According to Dr Jacques Piette, Groupe Interdisciplinaire Génoprotéomique Appliquée Research Director at the Université de Liègeopens in new tab/window, Belgium, and Editor of Elsevier’s Biochemical Pharmacology, it is also a method that is sadly misused and vigilance is needed in evaluating these images (6).
Dr Piette has highlighted eight key points to consider:
1. Pay attention to the overall quality of the Western Blot (WB). The bands should be well-marked. Do not accept a WB with fuzzy or smearing bands.

Dr Jacques Piette
2. Do not accept a WB with over-loaded or over-exposed bands because they are impossible to quantify.
3. Request that the WBs be quantified and statistically analyzed.
4. Do not accept a WB where the samples to compare have been loaded on more than one gel.
5. Do not accept a WB without the proper loading controls:
They should not be over-exposed.
They should be made using proteins extracted in the same conditions as the analyzed proteins. Example: if a nuclear protein is analyzed, the loading control should be made with a nuclear protein and not with a cytoplasmic protein - quite often the case!
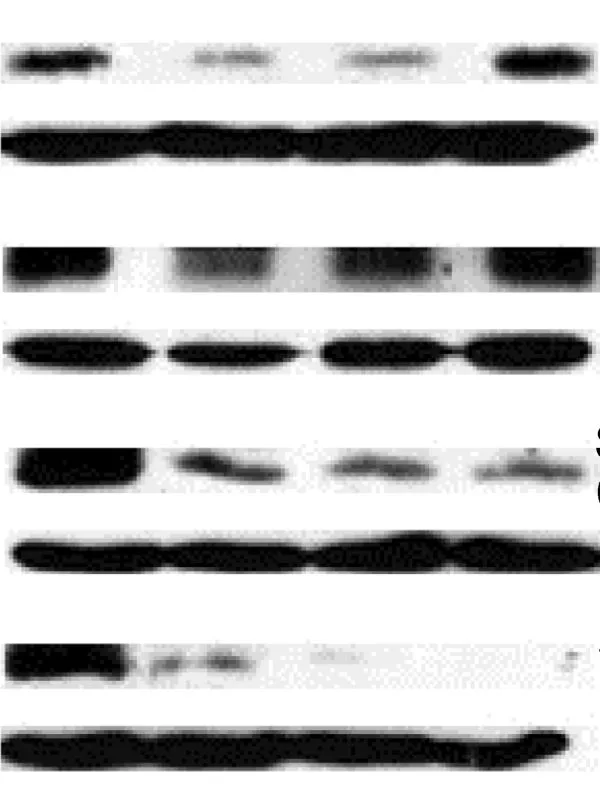
Figure 1: An example of a Western Blot suffering overloading or over-exposure problems, and inappropriate gel cutting. The accompanying paper also lacked quantification and statistical analysis around the WB.
6. Pay attention to the fraudulent use of the same loading controls in several different WBs.
7. Primary and secondary antibodies must be described in the Materials and Methods section. If the antibodies are not of commercial origin, their characterization must be described.
8. If there are doubts about a WB, do not hesitate to ask the authors to provide an image of the full WB.
The Guide for Authors of many journals do not carry any information around submitting Western Blots.Biochemical Pharmacology is one of the few that does. If a journal receives a large number of Western Blots, the editor might consider amending the Guide accordingly. Any editors interested in working together on a common text on Western Blots should contact me, Anthony Newman, at [email protected]opens in new tab/window.
Contributor
