How knowledge graphs can supercharge drug repurposing
8 de febrero de 2024
Por Joe Mullen, PhD
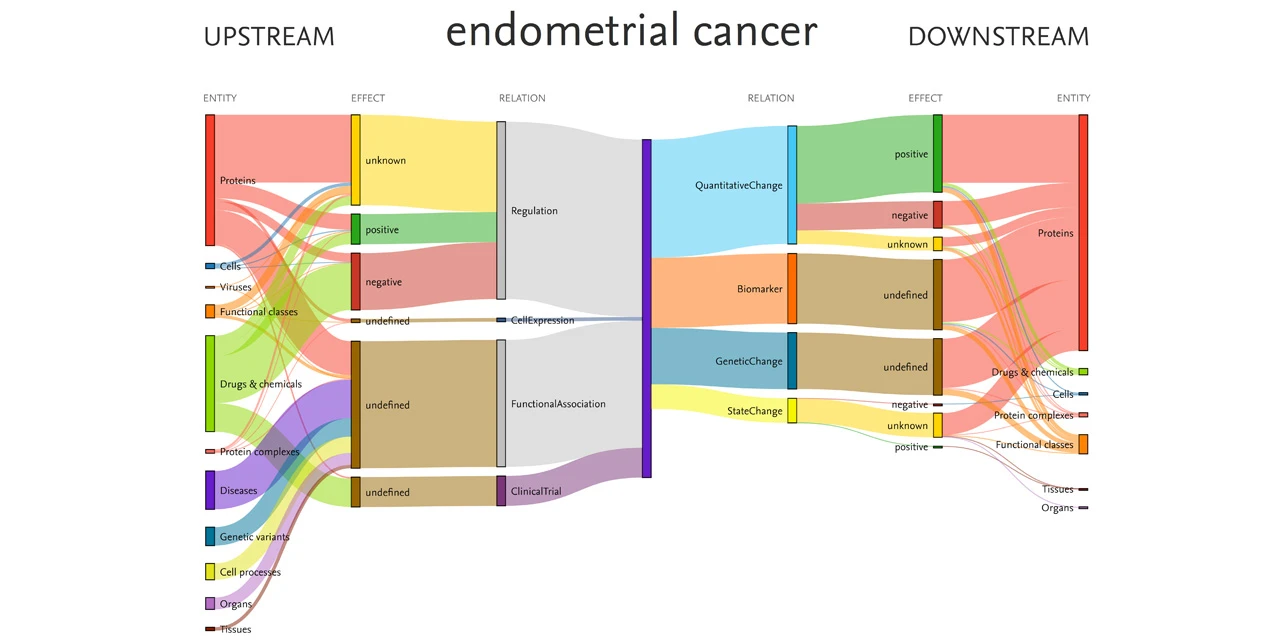
This Sankey diagram was produced from data within Elsevier’s Biology Knowledge Graph and shows relationships among the disease endometrial cancer and associated entities, including drugs and proteins. Source: EmBiology
Knowledge graphs offer multidirectional insight into drugs, diseases and targets to accelerate drug repurposing — but organizations must address key questions to benefit from this technology.
Finding new uses for existing drugs reduces the time and cost of developing new therapies and benefits patients by bringing them to market sooner. But drug repurposing is more complex than it sounds, and many companies struggle to bring projects to fruition. Often, this is because they lack a data and search strategy that enables deep, multidirectional insight into what we call the drug repurposing triumvirate: drug, disease, target.
It is essential that researchers can visualize and analyze the complex relationships between these entities. Doing so requires a search strategy that goes beyond a 2D “flat” search via a traditional relational database. It demands a purpose-built solution that can handle domain specific terminology. The answer — knowledge graphs: the “3D” search upgrade for drug repurposing.
The intuitive power of a knowledge graph
Knowledge graphs are a powerful data science technology that connects data to visually represent a network of entities and relationships. Importantly, knowledge graphs capture facts. This is vital for evidence-based decisions in fields like life sciences, where bad decisions can have dire consequences. This also differentiates knowledge graphs from other approaches such as open-source large language models (LLMs), where veracity is not guaranteed.
However, there can be considerable interplay between knowledge graphs and private LLMs to the benefit of researchers. LLMs can aid in the generation of a knowledge graph and can lower the barrier to entry when it comes to interrogation of graphs, enabling users of all experience levels to benefit from knowledge graphs. For example, converting natural language prompts into native graph query languages, such as Cypher, enables non-data science experts to question a knowledge graph.
In a repurposing scenario, a knowledge graph is an intuitive and, importantly, explainable way of viewing the drug, disease, target triumvirate. Building a knowledge graph requires foundational data technologies to be in place. The first step is mapping equivalent concepts from different data sources into ontologiesopens in new tab/window. Ontologies are a technique for organizing data beyond lists and thesauri to categorize concepts based on a logical, shared framework. This logic-based way of defining concepts produces a shared vocabulary that is machine processable.
The next step is the application of semantic annotation tools to scan vast quantities of scientific publications and then normalize scientific concepts to unique entity IDs. These IDs are mapped to public standardsopens in new tab/window, so all evidence mined from the literature, alongside supporting evidence from the public domain and internal data systems, can be pulled together to be presented in a searchable knowledge graph.
The logic-based collation and organization of data in a knowledge graph allows researchers to look at drug repurposing questions “in the round,” from every angle. The benefits of this 3D approach are:
More relevant search results: Data organized in a knowledge graph powers more accurate and relevant answers to user queries.
Easier data integration: Data connected from multiple sources, both internal and external, are integrated in a single destination via a unified view.
Enables discovery: The ability to infer relationships and connections can reveal new insights that weren’t visible before. While flat search of a relational database only shows the relationship between A–B, and B–C, a knowledge graph’s underpinning logic also infers the hidden relationship between A–C.
Powers AI and machine learning: Knowledge graphs support further adoption of advanced technology including AI/ML, natural language queries, automation and scenario modelling.
Exposes gaps or errors: It’s easier to visually identify gaps or data errors with a knowledge graph, which can be subsequently amended to improve data quality and accuracy.
Traces data provenance: The user can see where every relationship has come from, enabling evidence-based decision making.
Dynamically updated: Data pipelines that feed knowledge graphs are updated automatically and in real-time, so researchers are sure decisions are made based on the latest scientific data.
Why knowledge graphs are the perfect fit for drug repurposing
Knowledge graphs are highly customizable. They can be enterprise level or for a specific use case or project. The enterprise-wide model is useful for finding and collating all existing data an organization holds on a particular topic. Complex and specialist questions — such as those in drug repurposing — can be probed and answered in detail with a use-case based knowledge graph. Repurposing questions might include:
What genes are most strongly associated with a disease in the literature, and is there supporting evidence from other sources (e.g., GWAS, OMIM, Orphanet)?
Show me all drugs known to inhibit my target of interest and list out the adverse events.
What drug target should I prioritize in my disease area based on known mechanisms, safety profiles and competitor activity?
These smaller, fine-tuned knowledge graphs could potentially be stitched together using an LLM to convert natural language to graph-based query syntaxes. Coupling this with a registry of applications and an ability to route queries to the relevant knowledge graph, along with frameworks that provide memory, could enable the iterative interrogation of multiple knowledge graphs through a single interface. This results in the best of both worlds — a reliable and robust source of data combined with the LLM’s power to write code and convert natural language queries to the syntax of the knowledge graph tool, e.g., SPARQL for triple stores.
A knowledge graph can provide answers in whatever way suits the recipient based on their level of data maturity. For example, one lab team might want only the results of the search, e.g., 20 potential repurposing targets in an Excel sheet to further investigate, rather than full access to the knowledge graph. Another team could opt to receive the knowledge graph itself so their internal data science team can overlay it with other datasets, question the data more deeply, and apply other algorithmic analyses for complex projects. This flexibility means knowledge graphs fit the Data–Information–Knowledge–Wisdom pyramid, helping a company move from data to wisdom regardless of internal skills.

The Data–Information–Knowledge–Wisdom pyramid (Source: Zeleny M, 1987, cited in Procedia Computer Science, 2022opens in new tab/window)
5 questions to ask
To use knowledge graphs successfully in drug repurposing, you need to address these questions:
Is our organization ready? Have we identified the specific question we are looking to answer or is the knowledge graph a hammer looking for a nail?
What data do we have and what data do we need? Have we considered a breadth of sources, or do we need to source more data internally and externally to answer the research question?
How will the knowledge graph be used? Do we want a list of answers, or do we want the knowledge graph? And what UI will be required if internal users are given access to it? This ensures the outputs are used in the way you intend by the people you intend.
Have we laid the groundwork of foundational data technologies? This is a crucial step. Are data mapped to ontologies, semantically enriched, and aligned with public IDs?
What skills do we have and what help do we need? A successful knowledge graph and underlying foundational technologies are typically beyond the in-house data science skills of many pharmaceutical companies. Organizations will often bring in external expertise to build effective knowledge graphs.
Contribuidor

Joe Mullen, PhD
Director of Data Science & Professional Services, SciBite
Elsevier
Leer más acerca de Joe Mullen, PhD