Editors' Update - supporting editors, every step of the way.

Votre navigateur n’est malheureusement pas entièrement pris en charge. Si vous avez la possibilité de le faire, veuillez passer à une version plus récente ou utiliser Mozilla Firefox, Microsoft Edge, Google Chrome, ou Safari 14 ou plus récent. Si vous n’y parvenez pas et que vous avez besoin d’aide, veuillez nous faire part de vos commentaires.
7 décembre 2016
Par Hans Zijlstra, Rachel McCullough

Elsevier’s new metrics provide comprehensive, transparent, current insights into journal impact
Editor's note: Please be aware that some of the information in this 2016 article might be outdated. You are recommended to visit this page for the latest information on CiteScore.
Impact plays an important part in understanding the performance of a journal over time and making decisions about its future. It is impossible to get a true picture of impact using a single metric alone, so a basket of metrics is needed to support informed decisions.
Today Elsevier is launching CiteScore metricsopens in new tab/window: a new standard that gives a more comprehensive, transparent and current view of a journal’s impact that will help you guide your journal more effectively in the future.
CiteScore metrics are part of the Scopus basket of journal metrics that includes SNIP (Source Normalized Impact per Paper), SJR (SCImago Journal Rank), citation- and document- counts and percentage cited. The integration of these metrics into Scopus provides insights into the citation impact of more than 22,220 titles.
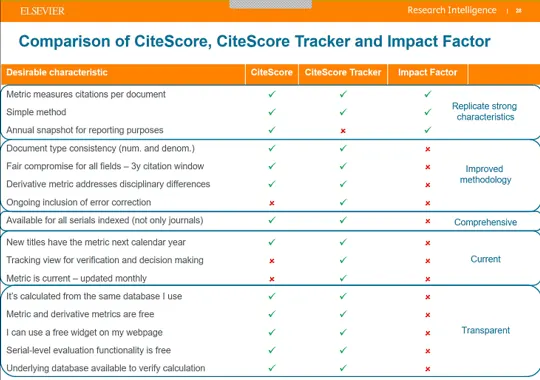
CiteScore provides many additional benefits compared to existing metrics
CiteScore metrics are a family of eight complementary indicators listed below. You can find out more about the individual indicators on the Scopus Journal Metrics websiteopens in new tab/window.
CiteScore
CiteScore Tracker
CiteScore Percentile
CiteScore Quartiles
CiteScore Rank
Citation Count
Document Count
Percentage Cited
CiteScore itself represents a robust approach for two reasons:
The three-year citation window. Researchopens in new tab/window has found that in slower-moving fields, two years’ worth of data is too short; yet five years is too long to consider in faster-moving fields. Three years is the best compromise for a broad-scope database, such as Scopus, as it incorporates a representative proportion of citations across all disciplines while also reflecting relatively recent data.
CiteScore’s numerator and denominator both include all document types. This means not only articles and reviews but also letters, notes, editorials, conference papers and other documents indexed by Scopus are included. As a result, the numerator and the denominator used in the CiteScore calculation are consistent. This approach gives a more complete picture of citation impact and makes manipulating the calculation more difficult.
CiteScore is essentially the average citations per document that a title receives over a three-year period. It is simple to replicate. A CiteScore 2015 value is available for most active serial titles in Scopus ― journals, book series, conference proceedings and trade journals ― that started publishing in 2014 or earlier.
The calculation of CiteScore is straightforward with no secret algorithms or hidden details. The freely available Source Details screen on Scopus displays the exact figures used to determine the score.
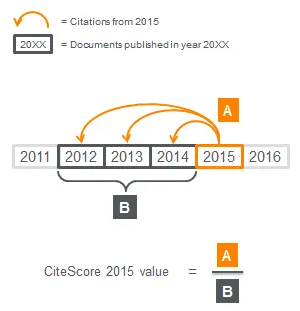
CiteScore metrics calculate the citations from all documents in year one to all documents published in the prior three years for a title. This offers a more robust and accurate indication of a journal’s impact. As an example, to calculate a 2015 value, CiteScore counts the citations received in 2015 to documents published in 2012, 2013 or 2014. This number is divided by the number of documents indexed on Scopus published in 2012, 2013 and 2014.
CiteScore is calculated on an annual basis, showing the average citations for a full calendar year. But impact can change faster than that, so CiteScore Tracker provides a current view of how a journal is performing during the course of the year, as it builds up each month.
What’s more, new titles can receive CiteScore metrics the year after they are first indexed by Scopus. And because CiteScore automatically covers all applicable serials, there is no complex application process or unclear omissions, keeping the CiteScore indicators that compare journals, such as CiteScore Rank, up-to-date.