How we help researchers find that needle
2022年11月3日
Patrick McGinty

It’s increasingly difficult for researchers to find relevant content, but machine learning can power useful tools
To generate this image, author Patrick McGinty used Dall-E 2 — an AI system that uses machine learning to create images from a description in natural language. Creators own the rights to the images.
Scientific output has been growing by over 4% annually since at least 2010opens in new tab/window, doubling in size every 17 yearsopens in new tab/window. The growth of modern science – and the global increase in prosperity and education inherent in that growth – is a success to be celebrated.
But it also presents a new type of challenge. Finding useful scientific research is even harder than “finding a needle in a haystack.” Rather, finding the right scientific information is like trying to find a needle in a stack of other similar needles – on the floor of a needle factory, at the end of a conveyor belt producing more needles at an ever faster rate.
Fortunately, machine learning can help by combing through a sea of data for a small set of manageable information a human can comprehend. That it can do this without direct human intervention is its greatest strength.
By automating the discovery and creation of new insights with machine learning, we can help to make your content accessible to the widest possible audience. Here’s how it works.
Machine learning on ScienceDirect
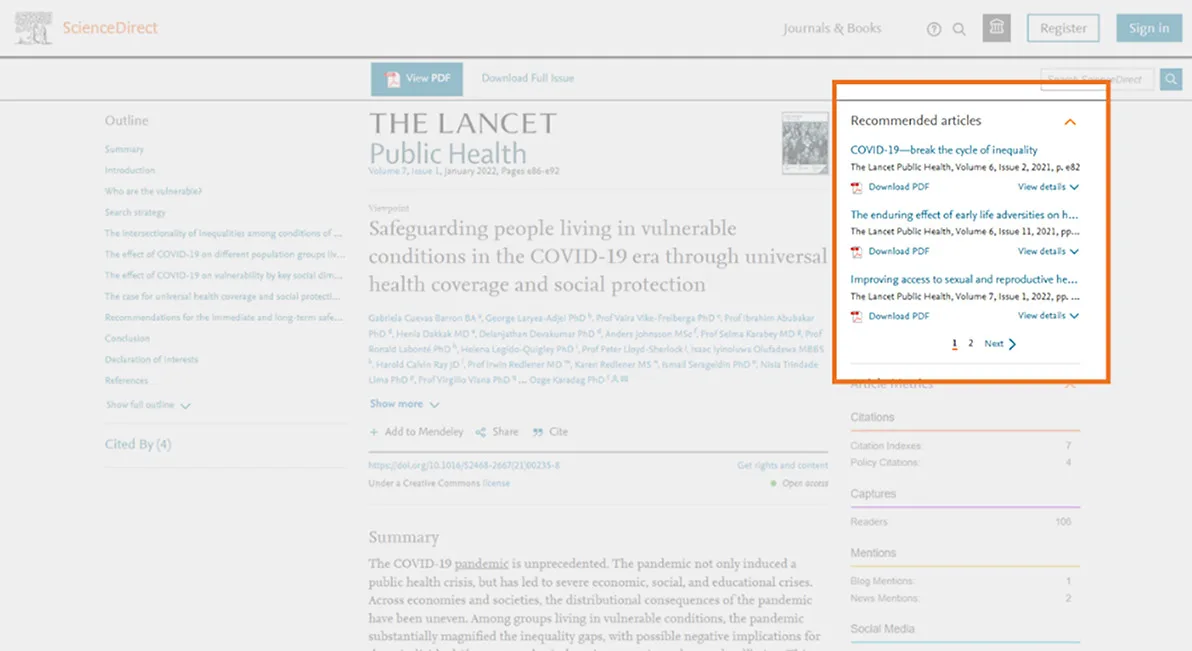
The recommendation tool results appear on every article page on ScienceDirect, suggesting six related articles on a small, easy-to-read carousel. (Charts by Patrick McGinty)
Any user of ScienceDirectopens in new tab/window will quickly encounter our recommendation tool, which combs over 18 million articles and chapters to produce six related articles for any given article. It does this every day, millions of times a day, with no human input beyond the activity of our users. As developers Anna Bladzich and Adam Davidson explain, the recommendation tool begins with two distinct sets of data: human behavior and the articles themselves:
First, the tool considers user behavior, analyzed in a matrix called collaborative filtering. This is simple association: readers who read article A also read article B. However, this approach can lead to predictable problems: some articles, such as medical guidelines, are simply more popular and more likely to be read by many users. So how can we surface new articles that readers would not have found on their own?
The answer is that the system needs to consider features of each article: not only the content of each paper but its overall subject, its recency, its citation network, its place of publication (in the same journal or a similar journal), and other criteria.
These two sets of data train a machine learning application called Learning to Rankopens in new tab/window to produce a small group of recommendations. The order of the recommendations in the tool is not accidental; it’s intended to reflect a literal ranking for the reader, and the first item is its best guess for what the reader will find most useful.
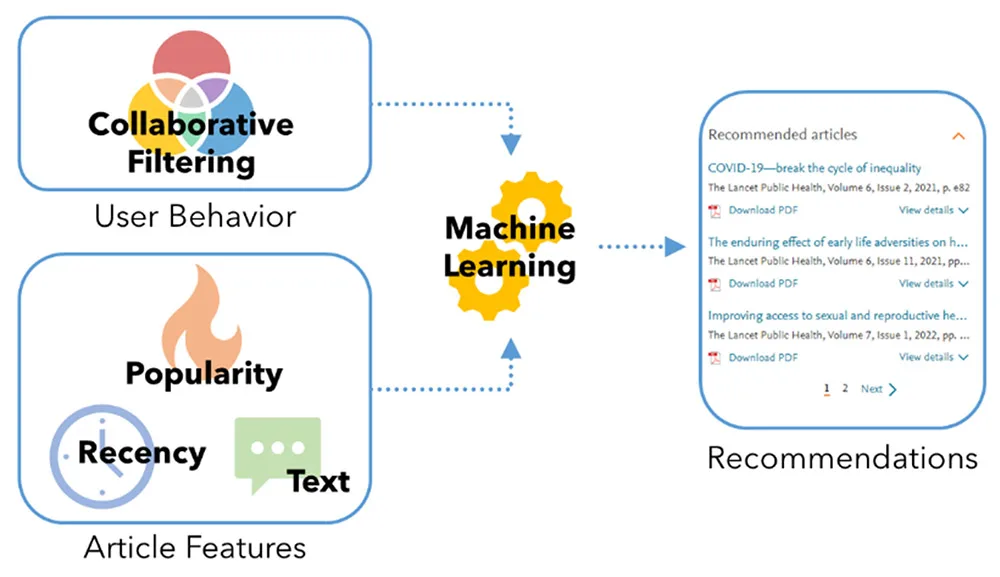
Recommendations related to each article are produced using a matrix of past users’ reading behavior, and the actual features of each article are rendered in a numerical format.
How successful are these recommendations? Initial scoring — in A/B testing with real users — showed that the recommendation tool produced consistent improvements of 7% to 10% in user engagements. However, our data scientists also acknowledged that any system could be further improved, especially in a world where new articles are always being published.
To that end, the recommender tool will improve on its own: it records the click-through rates of its own recommendations. The tool’s own performance becomes its third data set, gathered in real time, which allows the tool to learn and to improve. If a given recommendation is proving more attractive to readers, it will receive a higher ranking in the future. This continuous sorting and updating also allows new work to find its way into the tool for future readers.
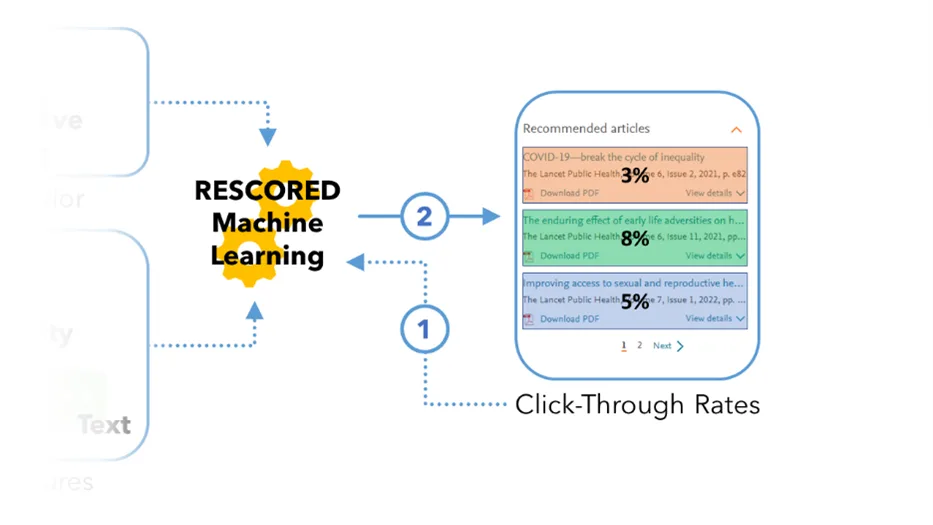
The recommender tool’s click-through rates become another part of the data in a new rescored set (1), which then produces a new set of rankings (2).
In short, the more the recommender tool is used, the better it becomes for everyone.
How machine learning powers your journal
Your society’s journal does not exist in a vacuum. Indeed, the most widely acknowledged ranking for journals, the Impact Factor, relies on the interconnectedness of scientific research to gauge the value of each journal.
But how do we build those associations in the first place? Following existing citations is easy but takes researchers down roads well-traveled already. By automating the discovery and creation of new pathways with machine learning, we can help situate your papers with their natural and nearest neighbors on ScienceDirect. Our recommendation tool makes every other article on ScienceDirect an opportunity to discover your journal – turning the wealth of research on ScienceDirect to your advantage, making apparent competitors into valuable allies, and bringing your newest work to the widest audience.
貢獻者
