At Harvard, developing software to spot misused images in science
January 23, 2018 | 10 min read
By Lucy Goodchild van Hilten
With support from Elsevier, a team is developing a tool to detect manipulated and misused images en route to publication
Caption: Design based on an overlay of sample images (one in red, one in green, overlap in yellow) used in Dr. Mary Walsh’s study.
When you’re submitting a manuscript to a journal, you might have to select the image for a figure from a folder with hundreds of different image files. It’s easy to make a mistake – the slip of a finger, a wrongly named file, a mistake in your notes. And that can lead to the wrong image ending up in your submission and, unless it’s spotted by the keen eyes of a reviewer or editor, in the published paper.
A review of 20,000 published papersopens in new tab/window revealed that nearly 4 percent of them contained inappropriately duplicated images – most often due to mistakes in data management, but some potentially resulting from misconduct. What if there were a way to detect image duplication and other manipulations so problems could be corrected prior to publication?
That’s what a team of data analysts and research integrity experts at Harvard Medical Schoolopens in new tab/window are doing. With support from Elsevier, the team is working with other facilities at Harvard, including the Image and Data Analysis Coreopens in new tab/window (IDAC), to develop a tool that can objectively indicate whether an image has been manipulated or is a duplication. That tool may ultimately feature in Elsevier’s editorial submission system.
Why images are manipulated – and how to spot misconduct
A manipulated image can be an indication of potential misconduct – it might be stretched, cropped, lightened, inverted or duplicated to change the meaning of the research. But it’s much more commonly a symptom of bad data management: a researcher might select the wrong image from a folder, for example. It’s therefore important to spot duplicated or manipulated images, not just to uncover the rare instances of misconduct but to highlight data mismanagement that can have significant consequences. Dr. IJsbrand Jan Aalbersbergopens in new tab/window, SVP of Research Integrity at Elsevier, explained:
There’s quite a lot of image duplication and manipulation out there. Some is more serious as it taints the research, but in the majority of cases, it’s bad practice that doesn’t change the outcome of the research. Scientists might want to zoom in on an image, delete parts or adjust the color to show something – it’s bad practice but not intentional misconduct. As publishers, we flag suspect images to institutions to investigate.

Ijsbrand Jan Aalbersberg
However, it’s not easy to spot or assess duplication or manipulation of images. People trawl through the published literature looking for discrepancies in published images, to see if they have been tampered with, or whether the same image was reused to represent the results of different experiments (image duplication). When mistakes are spotted, by publishers, peers or others, they are sent to the researcher’s employer. Research institutions often have a dedicated research integrity officer to investigate cases of potential misconduct, including those that feature image duplication and manipulation
At Harvard Medical School, Dr. Mary Walshopens in new tab/window, Chief Scientific Investigator, and Dr. Daniel Wainstockopens in new tab/window, Associate Director of Research Integrity, work with faculty panels that are convened to assess cases of reported misconduct. When images are involved, they gather all the relevant evidence so the faculty panel can determine whether the data were falsified, and if so, whether the falsification was deliberate or accidental. Dr. Walsh described the process of evaluating two images that seem similar to see whether they represent an inappropriate image duplication:
It’s manual and qualitative: when a person is analyzing images, their interpretation may not be as objective or systematic as if a computer were doing it. Once you have flagged a potential problem, the analysis process itself is done using tools like Photoshop or Fiji, using forensic functions. That process is qualitative – you have to describe the issues you might be seeing.

Mary Walsh, PhD
The faculty panels look at the careful but descriptive qualitative analysis, but without an idea of what constitutes “normal,” it can be challenging to make a judgment. Dr. Wainstock explained:
Is it really possible to say that two images that look like a match are more similar than the universe of normal images? Without statistical evidence, we have no way of answering that in a quantitative way. This was an issue for our faculty panels – they are experts and can make judgments with confidence, but we wanted to give them more support.
Trying to take a more systematic approach, Dr. Walsh started working with colleagues in other departments to develop a tool that could provide statistical analysis showing the degree of similarity between two images. Providing an objective quantitative value can help show whether the degree of similarity is too high to be a random coincidence, supporting people in a position of making formal decisions about research integrity.

Daniel Wainstock, PhD
Building a prototype
Working with the IDAC team at Harvard Medical School, Dr. Walsh developed the first version of the tool using MATLABopens in new tab/window. Dr. Walsh and the IDAC team started thinking about developing a second-generation tool that would use machine learning – and require less user input.
At that point, Dr. Wainstock, who was previously an Editor at Cell Pressopens in new tab/window, suggested that Elsevier’s research integrity department might be interested in the project. He explained:
As an editor, you sometimes see duplicated images. A lot of times it’s a one-off; someone made a random mistake and grabbed the wrong image. They will probably want to correct it, so you’d like to identify those cases and give the authors a chance to provide the correct images.
The team needed some additional funding for the prototype, and Elsevier provided a donation to support them. As a publisher, Elsevier wants to make sure its published content is correct, and it’s not possible for reviewers and editors to spot every possible issue. This is where a tool would be valuable – something that could be used during the submission and review process to check images. Dr. Aalbersberg commented:
We don’t want manipulated images in our articles; we want to sift out intentionally bad apples and also identify improper practice that can easily be fixed by sending the original images. We want to publish valid research. We have software that detects plagiarism, and having a tool that could quantify manipulation and duplication of images would help ensure the validity of published research.
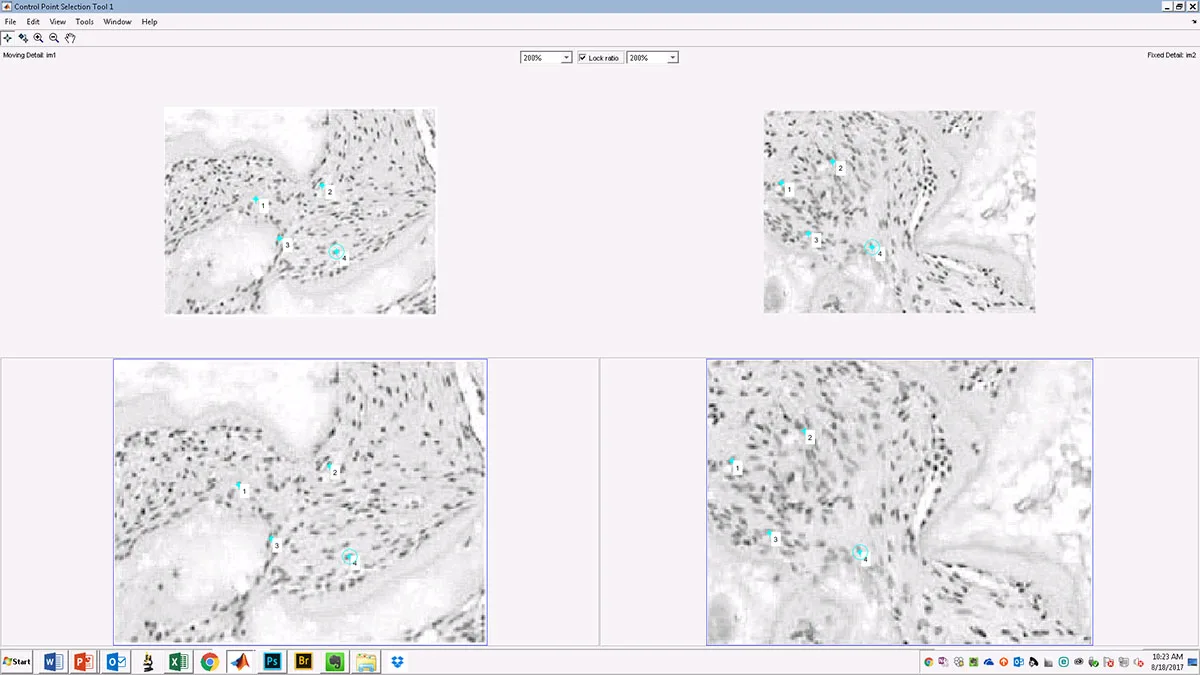
The first-generation IDAC tool analyzes a pair of images and obtains user input to define landmarks within them. It then outputs information that helps identify specific types of image manipulation and calculates the degree of correlation between the two images. For certain types of image data, such as microscope images of different cell culture samples within the same experiment, it’s unlikely you would find a correlation higher than 0.4 or at most 0.5. So for these types of data, an even higher correlation value, greater than 0.5, may suggest that the two images are actually of the same sample, not of two different samples.

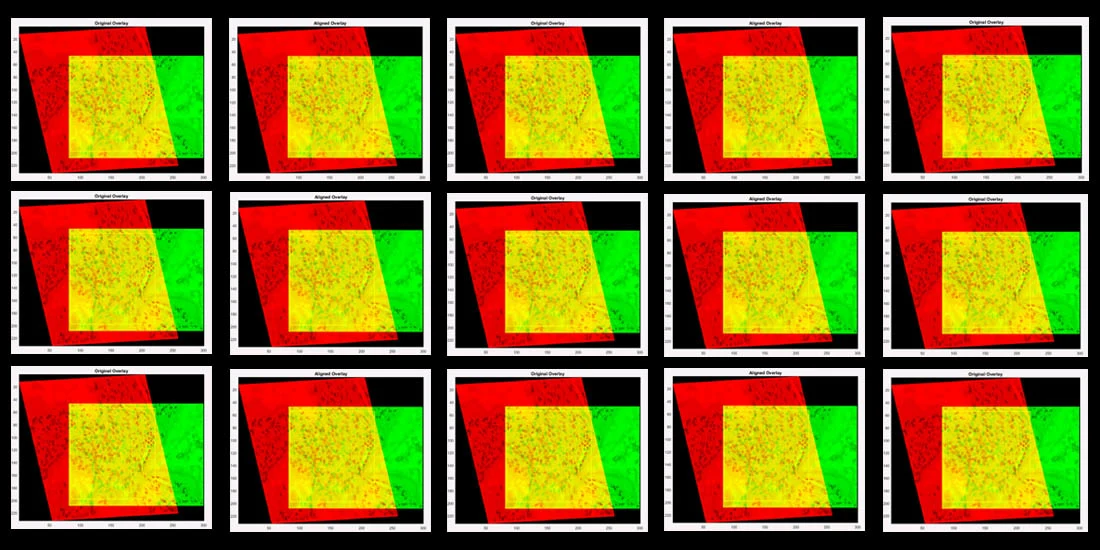
Caption: The algorithm produces a series of best-fit alignments, as demonstrated here. The first (left panel) best-fit alignment is based on user-defined anchoring points shared between the two images (see above), while the second (right panel) is based on a user-defined region of interest (ROI – yellow box). (Source: original images from Qin et al paper in Cell Stem Cell, published in 2013 and retracted in 2015)

Caption: Examples of visual overlays produced from algorithm-based best-fit alignments of sample images (anchored by user-defined ROI in yellow box): two candidate images that do not align (left panel; Pearson correlation 0.02) and two that do align (right panel; Pearson correlation 0.92). (Source: original images from Qin et al paper in Cell Stem Cell, published in 2013 and retracted in 2015)
The second-generation IDAC tool uses machine learning – specifically, training on a well-defined set of pairs of duplicate images (positive controls) and pairs of distinct samples (negative controls). This enables the algorithm to generate probability scores indicating whether two test images are too similar to be derived from different samples, without any further input needed from the user. This provides more objective information.
Involving the research community
Quantitative information becomes even more valuable when benchmarking is possible. By building the software to be open source, the team hopes to involve users in its development. But even with open-source software, a key resource is still missing: a shared “test” dataset that can be used to determine how effective each version of the tool might be. Dr. Walsh explained:
A lot of groups are taking different approaches to this, and a benchmark dataset that enables comparable tests of effectiveness across different platforms will be necessary not only for our work here but for the continued development and refinement of these efforts in the community. With a sizeable enough dataset, we can benchmark different problems – the community can figure out what is a good approach for spotting manipulation in specific types of data.
Currently the focus on detecting manipulation is on images in the biological sciences, such as Northern or Western blots – gels used in RNA or protein analysis that produce images of a series of dark bands on a light background. These images are simple and highly structured and therefore easiest for humans to assess. But the tool is most effective at detecting manipulation in more complex, unstructured images, such as microscopy images of cultured cells. The hope is that as the data analyzed broadens, the gaps in good data management will be highlighted.
Down the line, Dr. Walsh hopes something like a Google Image search for abstract databases might be possible, with raw search applicability. The team is already incorporating potential screening for image manipulation using deep machine learning. This is based on the Siamese neural network, which has been used successfully in facial recognition software. But in the more immediate future, the tool could become a critical part of the submission process, according to Dr. Aalbersberg:
Right now, there is no way to analyze the archives at the click of a button, but we may soon be able to run submissions through a tool like this and validate the images. Our job is to support editors and reviewers, and that includes giving them all the information we can about each submission. With an image manipulation detection tool, that information could include a quantitative analysis of the images submitted.
One year on from the donation, Elsevier is building on this work through three initiatives. In addition to the Harvard project, the Elsevier Labs team is developing software and the Research Integrity team is working with external vendors to explore other solutions. Dr. Aalbersberg continued:
We are committed to ensuring the research we publish is valid, and images are an important part of that. With an effective tool, we could identify potential cases of misconduct and also find opportunities to help researchers improve their data management, offering them tools like Hivebench and Mendeley Dataopens in new tab/window to ensure their future submissions are valid.
Daniel Wainstock, PhD
Dr. Daniel H. Wainstockopens in new tab/window is the Associate Director for Research Integrity at Harvard Medical Schoolopens in new tab/window (HMS). He coordinates assessments of possible research misconduct for HMS and its affiliates, and collaborates with practicing scientists to support the development of resources for research integrity and data management at HMS. His scientific training in developmental genetics (Ph.D. Biology, M.I.T.) and nearly 15 years of editorial and publishing experience (Cell Pressopens in new tab/window) in the fields of cellular and developmental biology inform his perspective on many aspects of research reproducibility.
Mary Walsh, PhD
Dr. Mary C. Walshopens in new tab/window is Chief Scientific Investigator, Office for Academic and Research Integrityopens in new tab/window (ARI), Harvard Medical Schoolopens in new tab/window (HMS). She is responsible for the forensic analysis of scientific research relevant to issues of potential academic misconduct at HMS. Current responsibilities include the application of advanced forensic analysis techniques and tools approved by the federal Office for Research Integrity throughout the course of an academic misconduct review, and reporting out to inquiry and investigation panels at HMS on all evaluations of potential misconduct following the conclusion of forensic data analysis. Prior to joining the ARI team, Dr. Walsh was Assistant Dean for Faculty Affairs at HMS.
Contributor

Lucy Goodchild van Hilten
Science Writer
TellLucy