Learn how Scopus can help your organization achieve its goals.

Unfortunately we don't fully support your browser. If you have the option to, please upgrade to a newer version or use Mozilla Firefox, Microsoft Edge, Google Chrome, or Safari 14 or newer. If you are unable to, and need support, please send us your feedback.
We'd appreciate your feedback.Tell us what you think!(opens in new tab/window)
Show more influence and attention to your research than you have ever been able to show before. Scopus metrics are a comprehensive, trustworthy and transparent way to demonstrate your journal, article, author and institutional influence.

CiteScore™ metrics: Introduced in 2016, a family of eight indicators to analyze the publication influence of serial titles. CiteScore metrics offer more robust, timely and accurate indicators of a serial title’s impact.
SCImago Journal Rank (SJR): A prestige metric for journals, book series and conference proceedings that weights the value of a citation based on the subject field, quality and reputation of the source.
Source-Normalized Impact per Paper (SNIP): Measures contextual citation impact by taking differences in disciplinary characteristics into account; can be used to compare journals in different fields.
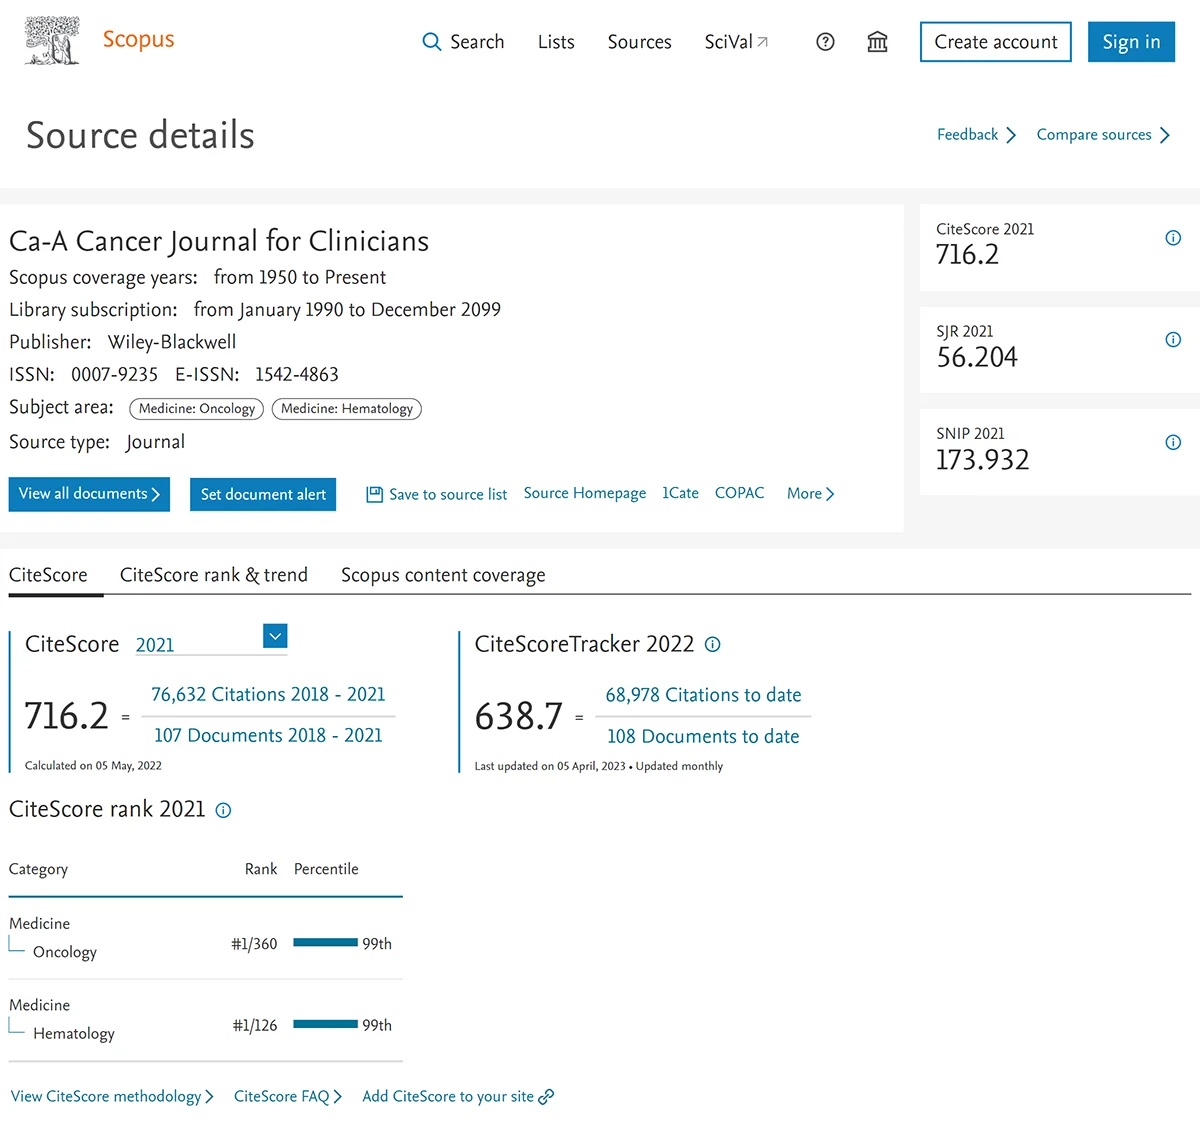
Source details screen web results at Scopus.com.
Four Scopus-specific metrics can be found on a document’s metrics details page: total number of citations by a date range of the user’s choosing, citations per year for a range, citation benchmarking (percentile) and Field-weighted Citation Impact. We've also recently added a new metric — views count — so users can understand usage at a glance.
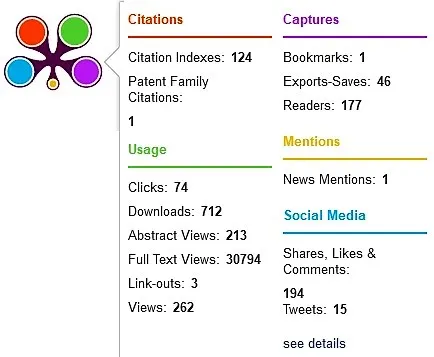
PlumX Metrics: Also found on a document’s metrics details page, five comprehensive, item-level metrics that provide insights into the ways people interact with individual pieces of research output (articles, conference proceedings, book chapters, and many more) in the online environment.
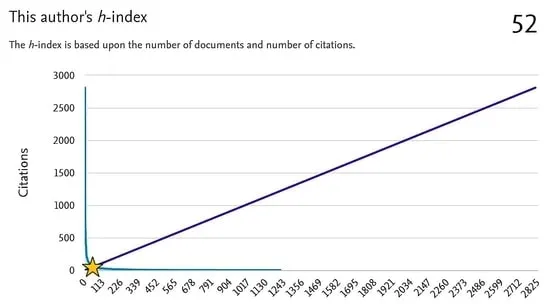
h-index and h-graph: View a researcher's performance based on career publications as measured by the lifetime number of citations that each published article receives; h-indices indicate a balance between productivity (scholarly output) and citation influence (citation count).
Citation overview tracker: An adjustable date-range table that includes the number of times each document has been cited per publication year.
Visual analysis tools: Analyze an author’s output with a collection of in-depth tools designed to provide a clearer picture of an individual’s publication history (up to 15 years) and influence: total number of cited documents, total number of citations per year, and a list of documents with numbers of citing documents and links to citing documents per year and per article.
Learn more about CiteScore metrics, a suite of eight metrics that tell a richer story about research and researcher influence.
Our Research Metrics Guidebook provides facts about how data underlying the metrics in Scopus (and SciVal) are used, how the metrics are calculated and displayed, and how variables besides performance can affect the metrics.
Download the guidebook (opens in new tab/window)Scopus Preview offers free access to journal rankings and other measures. Plus, you can view or download journal and book titles lists, and authors can check their profile and keep it up to date.
Use our free Scopus Preview to see journal rankings and other available metrics.
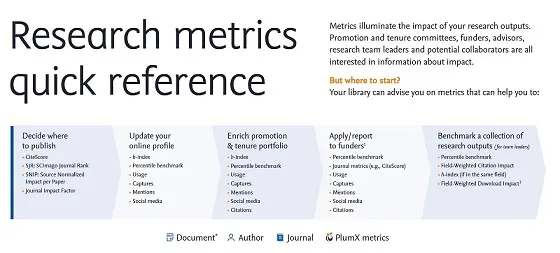
Librarians: For an easy-to-share handout on key research metrics, use our Research Metrics Quick Reference flyer, developed by Library Connect in collaboration with librarian Jenny Delasalle
Download flyer (opens in new tab/window)