Understanding Scopus & SciVal & the QS World University Rankings

What data do University Rankings use?
There are many global rankings organizations. These include magazines, newspapers, websites, higher education institutions and governments. Some rankings organizations specialize in international rankings, others in national or regional rankings, and a few do both. For an overview of seven major rankings organizations, download the quick guide.(opens in new tab/window)
Ranking methodologies rely on data inputs from a range of external resources. These resources often include university and researcher data, relevant data on human resources, student administration, finances, and data from reputation surveys — each varying based on a rankings' niche and focus.
In this guide, we focus on the bibliometrics used by Quacquarelli Symonds (QS)(opens in new tab/window) World University Rankings (WUR). For a broader look at university rankings, please visit Guide to University Rankings.
Bibliometric datasets
One dataset most rankers use as part of their methodologies is bibliometric data. This data is associated with the documents or publications (see Glossary) that researchers publish to share their findings. You can glean several data points and insights from bibliometric datasets, some of which are detailed below:
Number of citations received by publications from researchers at an institution.
Number of publications produced by researchers at an institution.
Research collaboration profiles, particularly international collaboration, of researchers and institutions.
Researchers’ institutional affiliation.
By using bibliometric datasets from a curated and authoritative source, rankers get a quantitative, consistent and comparable look at each university's research output to make it easier to compare them.
What challenges do universities face related to the bibliometric datasets used in rankings?
Understanding and obtaining the actual bibliometric data used to calculate the rankings is difficult. Because of this, if you are developing or executing a rankings strategy for your institution, you may find yourself creating proxies based on your best estimates, limiting the strategic value.
Two ways to help address this challenge are:
Understand the methodology behind the ranking and pay attention to changes annually.
Remove the need for manual curation and development of proxy indicators.
In this guide, we first discuss the QS World University Rankings methodology and bring further transparency to the bibliometrics underpinning them. Then, we will discuss ways to overcome the need for proxies and manual curation.
How are the QS World University Rankings calculated?
Quacquarelli Symonds(opens in new tab/window) — more commonly referred to as QS — ranking methodology(opens in new tab/window) evaluates universities through nine metrics, with several adjustments introduced in the 2024 ranking as noted below:
Academic reputation 30% (reduced by 10% in 2024 rankings)
Citations per faculty 20%
Employer reputation 15% (increased by 5% in 2024 rankings)
Faculty students 10% (reduced by 10% in 2024 rankings)
International students 5%
International faculty 5%
International Research Network 5% (introduced in 2024 rankings)
Employment Outcomes 5% (introduced in 2024 rankings)
Sustainability 5% (introduced in 2024 rankings)
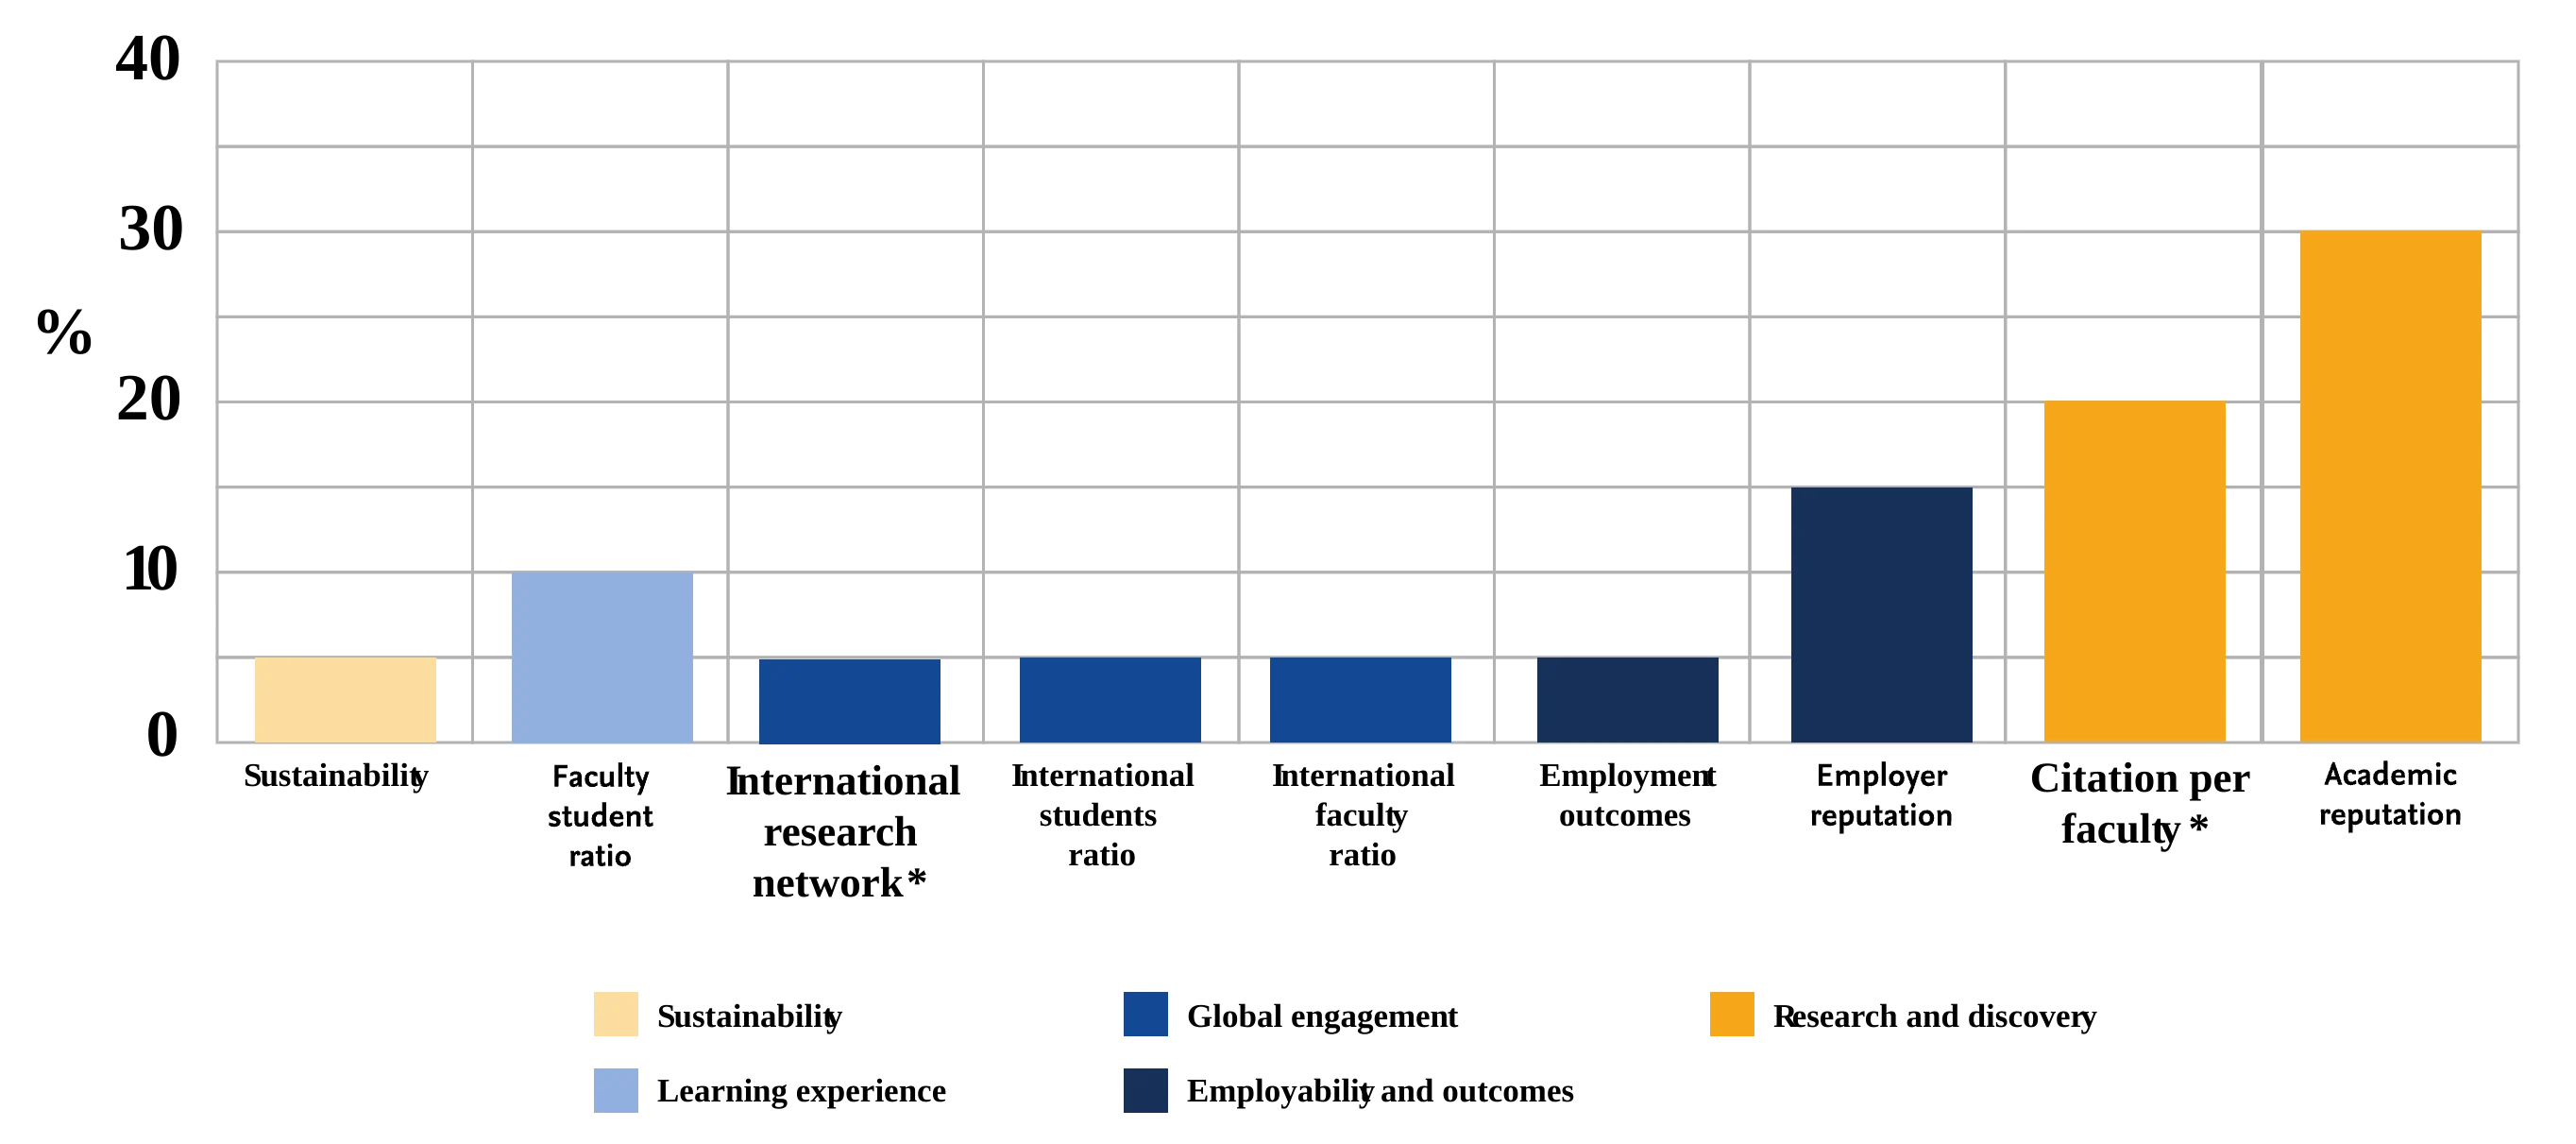
* Scopus contributes here
The weight distribution is applied across the six metrics QS uses in its WUR methodology. Adapted from QS website(opens in new tab/window) on September 29, 2023.
More detail on Citations per faculty (20%)
Scopus contributes the bibliometric data for this part of the QS ranking. To calculate the Citations per Faculty metric, QS divides the Normalized Total Citation Count by the number of Faculty reported by each institution, which is based on the Scholarly Outputs considered by QS. QS uses a five-year publication window for Scholarly Outputs and a six-year citation window, and the Normalized Total Citation Count is the arithmetic sum of the Citation Count in each faculty area, normalized per faculty area and an institution's country. This aims to ensure differences in publication and citation patterns across each faculty area are accounted for.
More detail on the International Research Network (IRN)
According to QS, the
IRN Index reflects the ability of institutions to diversify the geography of their international research network by establishing sustainable research partnerships with other higher education institutions.
It is an indicator of the strength and diversity of an institution’s research network as determined by sustainable research partnerships with international higher education institutions. Sustainable research partnerships are those that have resulted in three or more publications in the period considered, which then determines the subset of Scopus® publications considered in the metric calculation.
QS also applies the QS affiliation cap to identify the publications considered. This is designed to help prevent highly cited material produced by very large research groups from conferring too much credit on institutions that may have only contributed a small amount to the work. The cap varies per Faculty Area in order to ensure no more than 0.1% of research is excluded in a given field.
The IRN makes up 5% of the overall QS World University Rankings score. The calculation starts with the following formula:
IRN Index = L/ln(P)
Which divides the distinct count of international Locations (L) listed in considered publications by the natural logarithm of the distinct count of international Partners (P) (higher education institutions) in those locations.
The IRN Index is normalized by each of the five QS Faculty areas with each faculty area value, taken singularly, and also scaled and averaged. The total average value is again scaled to produce the final IRN indicator score.
You can find more information about the IRN on the QS support site here(opens in new tab/window).
Note about all QS research indicators.
All of the research metrics used by QS for every QS ranking in each ranking cycle are calculated using data from Scopus®, which Elsevier extracts at the beginning of each year. This extract is therefore used for the QS World University Rankings (WUR) and every other ranking in the cycle following the WUR.
How can I be included in the QS World University rankings?
To be considered for the rankings, a university must teach at undergraduate and postgraduate levels and conduct work in at least two of five possible faculty areas:
Arts and Humanities
Engineering and Technology
Social Sciences and Management
Natural Sciences
Life Sciences and Medicine
If you think your university meets these requirements, contact a QS(opens in new tab/window) representative for consideration. The representative may direct you to the Rankings Entry Evaluation. This data-rich tool allows institutions to understand how they’re currently performing in each of the nine key areas.
How does Elsevier contribute to the QS WUR?
Elsevier supports the ranking process by providing bibliometric datasets extracted from Scopus® regarding an institution’s research. The methodology ultimately used in the WUR is determined by QS. Elsevier partners with ranking organizations and research institutions to provide objective and authoritative bibliometric datasets in addition to providing bibliometric and data science expertise.
The Elsevier bibliometric datasets and metrics contribute to 25% of QS WUR methodology and overall ranking score.
Why does QS use Scopus data?
Scopus is a source of research publication data that several rankers rely on.
In 2015, after renewing their agreement with Elsevier, Ben Sowter, Senior VP at QS, said,
QS was the first of the global rankings compilers to identify Scopus as an excellent source of data to assess research activity and excellence of universities globally. Since 2007, Elsevier have been an accommodating and cooperative partner; this renewal of our collaboration represents a deepening of our working relationship and we are looking forward to exploring some of the new opportunities that it brings.
QS uses Scopus data in several rankings:
QS World University Ranking
54 Subject Rankings
5 Regional Rankings + BRICS (Brazil, Russia, India, China, and South Africa)
The “QS Top 50 under 50 Ranking” ranking universities that have been established for under 50 years.
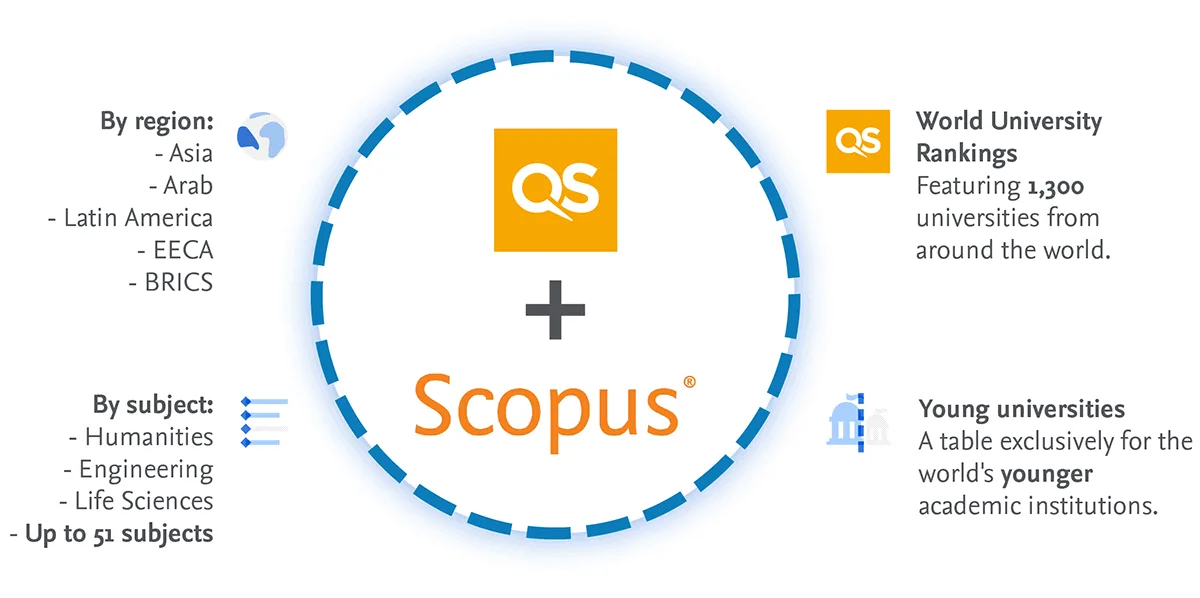
QS & Scopus
A closer look to understand where Elsevier bibliometrics contributes.
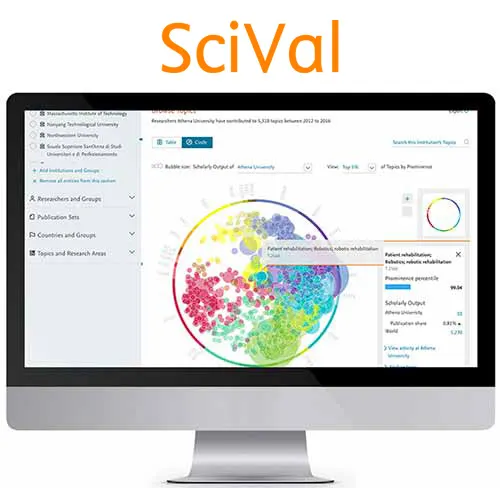
Elsevier offers research information and analytics solutions like Scopus and SciVal to assist universities in evaluating their research performance and developing research strategies — both in general and as it relates to their performance in university rankings.
You can use SciVal, to access and analyze the actual bibliometric datasets used by ranking organizations such as QS and THE in their World University Rankings methodology. This can inform your rankings strategies or help you analyze your publication output, citation impact, collaboration patterns and other factors that can influence ranking metrics and outcomes.
How are the Scopus and SciVal related? Scopus is the authoritative and trusted bibliometric database the major rankers choose to provide the bibliometric datasets they use in their methodologies. SciVal provides access to the actual bibliometric datasets and metrics that the ranking organizations used in their calculations for all institutions ranked, adding analytical power and flexibility. This removes the need to develop proxies of the indicators and metrics, increasing the strategic value and helping you investigate and understand the drivers behind the bibliometrics used in rankings.
What is Scopus® Data?
It is important to understand Scopus’s role in the rankings to ensure that rankers such as QS and THE accurately reflect your institution.
Scopus is an authoritative, source-neutral abstract and citation database curated by independent subject matter experts.
There are three things you need to know about Scopus:
What is in the database, and which parts inform QS rankings?
What is an institution or organization profile, and how can I view mine?
What are author profiles?
The Scopus Database
Scopus uniquely combines a comprehensive, curated abstract and citation database with enriched data and linked scholarly content. It is a structured source of publication items (see Glossary). The structure includes organizing the data generated in relationships, e.g., authors, citations, institutions, etc.
This video describes the elements about Scopus Data you need to know to understand the background for QS university rankings.
Scopus database
The video showed that Scopus contains millions of data points, 7000+ publishers, platforms, and sources. In addition to all this data, Scopus uses artificial intelligence to connect the data to the correct authors and institutions.
Scopus is organized in a structured way so you (and QS) can use it to find insights about your research. Further, by using the API, data can be extracted and used in other institutional systems.
Author Profiles, Institution Profiles and Affiliation Hierarchy
When discussing rankings, it is important to discuss Scopus Author and Institution Profiles and the affiliation hierarchy. When calculating their ranking reports, both THE and QS use these to attribute the correct research to your institution.
The Institution Profile Wizard (IPW) allows institutions to modify their institution profiles and correct their organizational hierarchies to ensure the set of institution profiles are grouped together and displayed on Scopus are accurate. This ensures ranking organizations see a clear picture of institutions' research activity.
Authors can also check and validate their Scopus Author Profiles through the free Author Profile Wizard (APW). Although Scopus has a high level of accuracy and recall for Author Profiles, enabling authors themselves to check and validate their profiles further improves both data accuracy and data confidence.
Although authors can check their profiles through the free APW, for institutions with high Scopus adoption, researchers are naturally more active in accessing and maintaining their author profile.
Scopus Data & Ranking Organizations: An example
You can see an example of how Scopus Data, Institutional profiles and Rankings work together by looking at Li. Li works in the office of research and needs to meet a challenge posed by his Vice-chancellor:
Determine the contributing factors to university rankings
Develop a plan to show the university in its best light
The role of Scopus in university rankings
Scopus contains artificial intelligence to develop affiliation hierarchies correctly. It is always good to periodically check to make sure it is accurate. In this way, rankers such as Times Higher Education and QS have a precise picture of your publication data. You can use the Institution Profile Wizard (IPW) to make changes.
How can SciVal help you understand your university’s research & ranking?
SciVal is built upon the foundation of trusted, globally sourced data from Scopus which is further enriched with supplementary information from sources such as policy and patent data. All of this data is linked to the underlying publications in Scopus. By utilizing advanced data science and artificial intelligence, it can provide comprehensive analytical capabilities and meaningful insights into global research activities and bibliometric datasets underlying university rankings.
In other words, SciVal brings to life insights into your institution’s research activities against global peer benchmarks as well as emerging research trends to enhance research strategy and decision-making. With uniquely adaptable analyses and flexibility, you can evaluate and showcase expertise and impact at the researcher, department, faculty and university level and support future funding and research success.
How can SciVal help you with your rankings analyses and strategies and remove the need for proxies?
Rather than relying on manual curation and the development of proxy indicators, SciVal’s rankings analysis enables you to investigate, understand and generate insights based on the actual bibliometric datasets used in the QS World University Rankings (QS WUR), as well as the bibliometric datasets used in the THE World University Rankings (THE WUR) and the THE Impact Rankings.
For QS WUR, this means you can analyze, understand, and gain insights from the actual bibliometric dataset used by QS, which contributes 25% of the overall ranking score. In the image below, you see this in action.
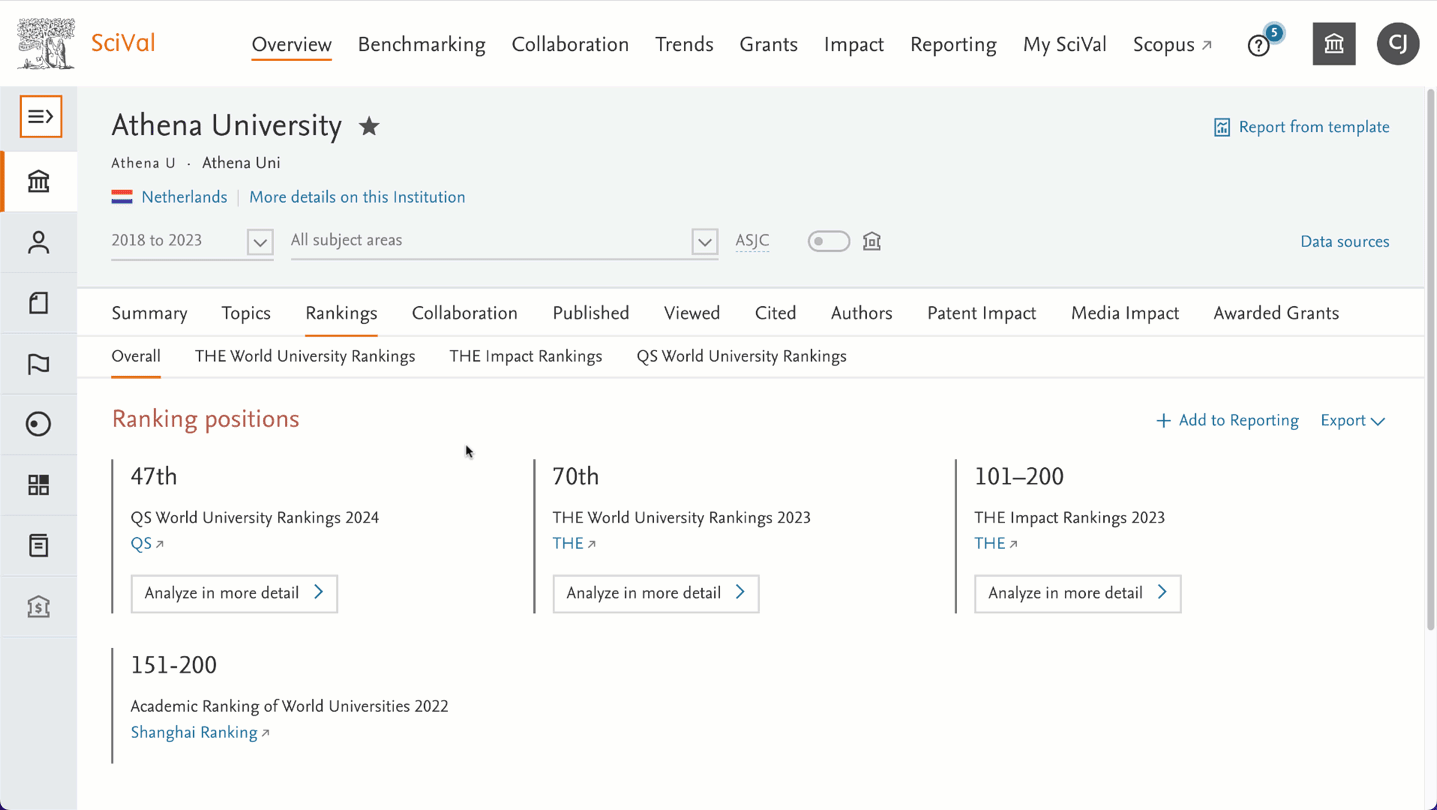
Here you see the QS WUR 2024 for a university within the Rankings analysis feature of the Overview module in SciVal.
This includes a detailed view of the institution's performance across each bibliometric indicator used in the QS WUR 2024 for all ranked institutions. The bibliometric datasets and detailed views are also available for QS WUR’s 2021 to 2023, enabling you to analyze the drivers behind the scores across each ranking year. Furthermore, SciVal enables you to benchmark your rankings performance to any global peer through access to the bibliometric datasets within the Benchmarking module. This further enhances your ability to understand your position and the drivers underlying any institution's rankings performance. Extensive metric guidance also helps you learn about the new and previous ranking methodologies.
The insights you gather from the ranking analysis feature are designed to help you gain a deeper understanding of your position and the drivers underlying the rankings, and to inform your rankings strategy.
Although SciVal cannot predict where you will be placed on any future ranking, especially as there are many factors involved, it can help you better address questions related to the bibliometric datasets and indicators that inform current rankings. The insights gained can be fed back across your strategy and, or development plans.
Overall, no matter your position and role at a university, if you need to understand university rankings there are a variety ways SciVal can support you, such as:
Creating management-level reports based on deep-dives into the bibliometric-based data used in major rankings.
Creating benchmarking reports against peers across the bibliometrics used in rankings.
Use analyses to inform development of faculty and department-level strategic plans and publication strategies.
Summary
In conclusion, Scopus® is an authoritative and comprehensive database, trusted by major ranking organizations, for accurate and connected bibliometric datasets. It is also at the core of SciVal. By combining access to the actual bibliometric datasets with the analytical power and flexibility of SciVal, together with the breadth and depth of connected bibliometric data from Scopus®, you gain a digital consultant that not only helps you answer questions related to rankings, but also helps uncover insights you can apply across your research programs and strategic planning.
Glossary Items
In Scopus, items are also called documents. There are many document types:
Document Type | Definition | More Detail |
Article | Original research or opinion | Articles in peer-reviewed journals are usually several pages in length, most often subdivided into sections: abstract, introduction, materials & methods, results, conclusions, discussion, and references. However, case reports, technical and research notes and short communications are also considered articles and may be as short as one page in length. Articles in trade journals are typically shorter than in peer-reviewed journals and may also be as brief as one page in length. |
Article-in-Press (AiP) | Accepted article made available online before the official publication | |
Book | A whole monograph or an entire book | Book type is assigned to the whole. Additionally, for books with individual chapters, each chapter, along with a general item summarizing the book, is also indexed with the source type Book. |
Chapter | A book chapter | A complete chapter in a book or book series volume where it is identified as a chapter by a heading or section indicator. |
Conference paper | Original article reporting data presented at a conference or symposium | Conference papers are of any length reporting data from a conference, except for conference abstracts. Conference papers may range in length and content from full papers and published conference summaries to short items as short as one page in length. |
Data paper | Searchable metadata documents describing an online accessible dataset, or group of datasets. | A data paper intends to offer descriptive information on the related dataset(s), focusing on data collection, distinguishing features, access, and potential reuse rather than report on data processing and analysis. |
Editorial | Summary of several articles, or provides editorial opinions or news | Editorials are typically identified as editorial, introduction, leading article, preface or foreword, and are usually listed at the beginning of the table of contents. |
Erratum | Report of an error, correction, or retraction of a previously published article | are short items citing errors in, corrections to, or retractions of a previously published article in the same journal to which a citation Erratais provided. |
Time Higher Education uses five publication types when calculation rankings:
Articles
Reviews
Conference Proceedings
Books
Book Chapters
FWCI
Field-Weighted Citation Impact is a metric that considers different citation practices in other fields you can compare them.
FWCI is calculated by the total citations received by the denominator’s output and the total citations that would be expected based on the average of the subject field.
A Field-Weighted Citation Impact of:
*Exactly 1* means that the output performs just as expected for the global average.
More *than 1* means that the output is more cited than expected according to the global average. For example, 1.48 means 48% more cited than expected.
Less than 1 means that the output is cited less than expected according to the global average.
Field-Weighted Citation Impact considers the differences in research behavior across disciplines. It is beneficial for a denominator that combines several fields, although you can apply it to any denominator.
Researchers working in medicine and biochemistry typically produce more output with more co-authors and longer reference lists than researchers working in fields such as mathematics and education; this is a reflection of research culture, not performance.
In a denominator comprising multiple disciplines, the effects of outputs in medicine and biochemistry dominate those in mathematics and education.
Using non-weighted metrics, an institution focused on medicine will appear to perform better than an institution that specializes in social sciences.
The methodology of Field-Weighted Citation Impact accounts for these disciplinary differences.
Scopus is the most authoritative abstract and citation database of peer-reviewed literature in the world.
SciVal is a powerful web-based data analytics solution that provides in-depth views into the research performance of thousands of institutions, and their affiliated researchers, across 231 nations worldwide.